
6.(b) How is cultural background of States of India reflected in the attributes of sex and age structure? 15 Marks (PYQ/2024)
Answer:
Introduction
The cultural diversity of India—from deeply entrenched patriarchal practices in some northern states to relatively progressive gender norms in southern regions—profoundly influences the sex structure (the ratio of females to males) and the age structure (the distribution of population across various age groups). Cultural norms affect family size, gender preference, and the societal roles assigned to the elderly, ultimately shaping the population pyramid of different states. For example, states such as Haryana exhibit skewed sex ratios due to strong male preference, while states like Kerala show more balanced ratios and an aging population, reflecting distinct cultural values and development stages.
Models
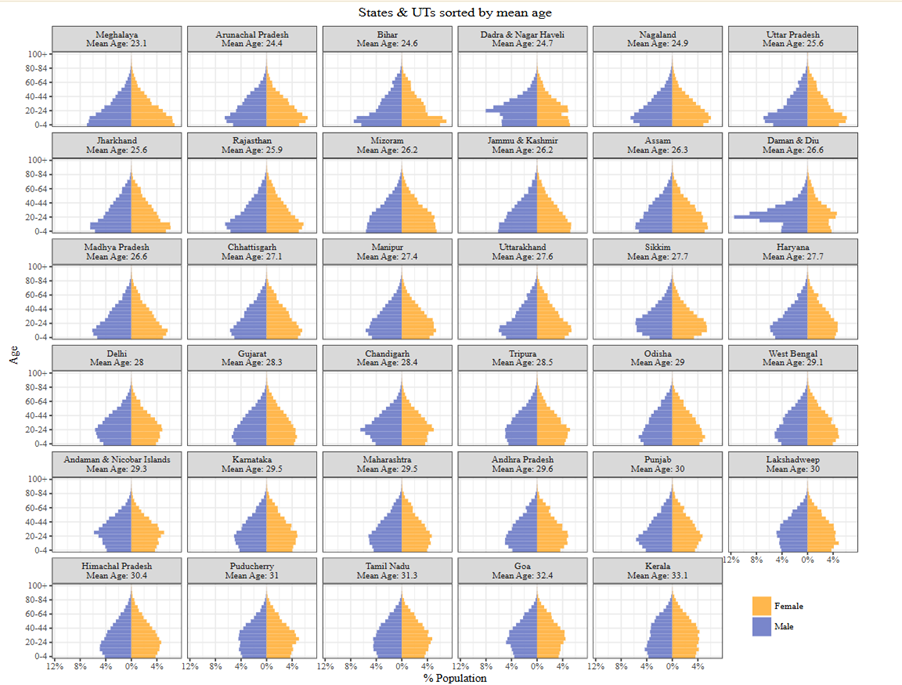
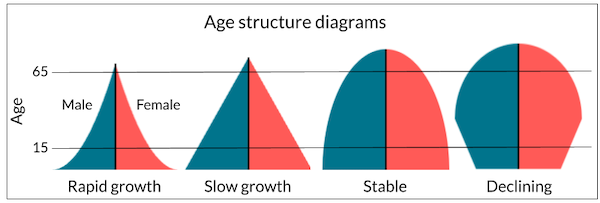
Population Pyramid (Age-Sex Structure) Model
- Description: The population pyramid visually represents a region’s age and sex distribution. It directly reflects cultural influences—such as preference for male children—by showing a skewed base in states with gender bias.
- Cohort Population Analysis: This analysis examines cohorts—groups of individuals born in the same period—to trace the evolving demographic patterns over time. Differences in cohort behaviors (e.g., marriage age, fertility rates) illustrate how cultural norms impact successive generations.
- Data Example: The Census of India (2011) shows Haryana’s sex ratio at approximately 877 females per 1,000 males, compared to Kerala’s 1,084.
Theories
Age Stratification & Cohort Flow Theory
- Theorists: Pioneers such as Riley (1976) and Foner (1975) have explored how age-based stratification shapes societal roles.
- Application: In India, cultural expectations lead to distinct age roles—with elders revered in certain cultures—and influence how each cohort transitions over their lifetime.
Demographic Transition Theory
- Overview: This theory, formulated by Notably, Warren Thompson and others, posits that societies move through stages—from high birth and death rates to low rates—as they develop economically and socially.
- Cultural Impact: In states where cultural practices favor smaller families and greater gender equality (as seen in Kerala), the later stages of the demographic transition are reached more quickly, resulting in an aging population. In contrast, states with strong son preference often remain in earlier stages with higher fertility.
- Key Insight: Demographic transition impacts both age structure and sex ratios, and cultural norms can accelerate or hinder this process.
Laws
Legal Frameworks Shaping Demographic Behavior
- Pre-Conception and Pre-Natal Diagnostic Techniques (PCPNDT) Act, 1994: This law is designed to counter gender bias by prohibiting prenatal sex determination. Despite its existence, regional cultural biases affect its enforcement.
- Constitutional Provisions & Gender Equality: Articles 29 and 30, along with reservation policies, guarantee cultural rights and promote equity, influencing long-term demographic trends. Source: Ministry of Health and Family Welfare; Census of India (2011).
Perspectives
Integrated Cultural and Socio-Economic Perspectives
- Sustainable Development Perspective (Brundtland Commission): This approach stresses that inclusive development—embracing gender equality and investing in human capital—leads to more balanced demographic profiles.
- Political Economy Perspective (Immanuel Wallerstein): Explores how cultural practices interact with economic structures to determine demographic outcomes.
- Key Insight: Policies promoting women’s empowerment and elder care can gradually transform skewed demographic structures.
Case Studies
Case Study 1: Haryana (Northern India)
- Overview: Haryana reflects a strongly patriarchal culture, leading to a significant gender imbalance.
- Data & Statistics: The Census of India (2011) records a sex ratio of 877 females per 1,000 males. This imbalance is exacerbated by cultural practices such as selective abortion and differential mortality.
- Source: Census of India (2011); Reports by the National Commission for Women.
Case Study 2: Kerala (Southern India)
- Overview: Kerala’s progressive cultural environment supports gender equity and high human development.
- Data & Statistics: Kerala’s sex ratio is 1,084 females per 1,000 males, with a rising elderly population indicating advanced stages of demographic transition.
- Source: Census of India (2011); Economic Survey of Kerala.
Conclusion
The cultural background of Indian states significantly shapes their sex and age structures. By employing population pyramid models, cohort population analysis, and integrating theories such as Age Stratification and Demographic Transition, coupled with robust legal frameworks and diverse socio-economic perspectives, we gain insight into the demographic contrasts of states like Haryana and Kerala. These insights are critical for formulating policies that foster equity and sustainable development across diverse cultural settings.
Tag:age sex ratio of indian states, attributes of sex and age structure of india, Cultural background of states of india, Geography Case Study, Geography Optional, geography optional case study, Geography Optional Pyq, geography optional pyq 2024, human geography, models theories laws and perspective in geography

